The Mining Industry was seen as an old-school investment, it was painted dirty by eco-zealots, over-taken by the Crypto Cool Kids, and dismissed by new-age financial whizz kids as falling behind the fads.
Those days are over, thrown down a well that is then capped with used tailings. Why?
- The environmental persuasiveness that worked its way on the left-leaning of society, has gone through its cycle and now lies in taters: Economies need resources for materials. Grids need baseload power. Hello Coal and Uranium.
- The boom in bits and bytes as mediums of exchange is nearing an end. You want to preserve wealth? Try a monetary metal. Try something that has 5,000 year old history (Gold!) and compare it to a string of code on a few servers that might not be around in 6 months, due to hackers, government intervention, or because the party has moved on. Precious metals are back.
- Following on from this vein, the financialisaton in the last 20 years has created wealth from commoditising anything remotely divisible with a financial heartbeat. That cycle is also ending: Making something of nothing in over-glorified Western Economies means that value seeker will have to seek value from what holds value: Resources. Want to build a data centre? You need copper.
What does this mean for the Mining Industry?
It is partly in a pre-millennium mentality and needs to grasp that to properly present its value to new investors it must:
Embrace communication that was just as punchy as recent trends.
- Push their unique-selling-points, because previous trends (tech, AI, Biotech etc) are still lingering, some of them will bounce back (as they should), and the investing world is still very competitive.
- Swim out to take AI head-on. AI tools mean investors can crunch a lot of research, so presentation from mining companies must be able to have that data ready to be reviewed in the right format.
- Stand out as Solid: An interesting aspect of mining, energy and manufacturing is that they are people + equipment + asset businesses. After the next financial roller-coast, investors will flocks back to solid investments.
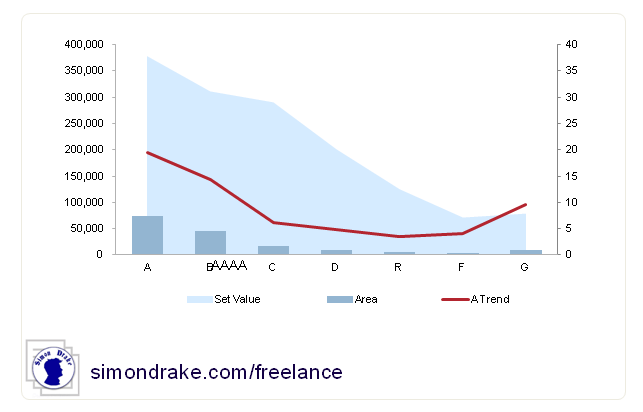
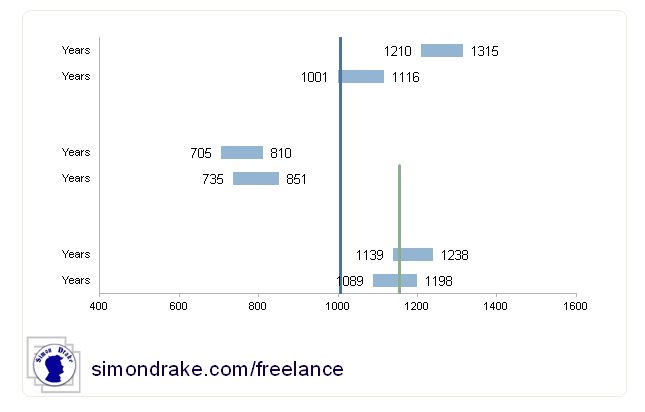
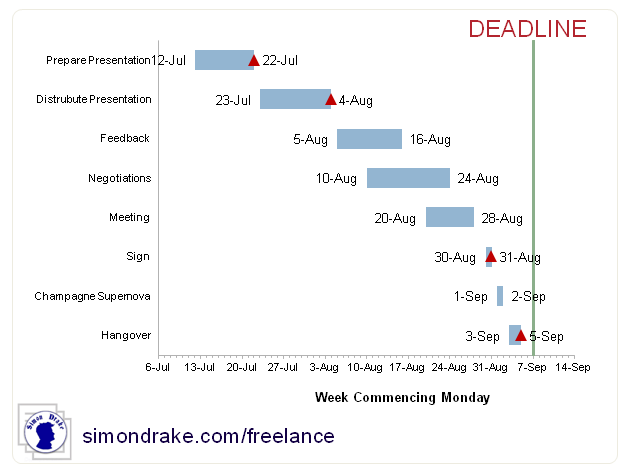
If your presentation for a mining company needs expert assistance with PowerPoint, Excel (including Chart and Graphics), adding Earth Observation, resources verification and permitting information, or implementing AI standards, get in contact.


